PL/SQL FINAL PRACTICAL QUESTION
👇
👇

There are many type of chart but we discuss here only famous and widely use chart only
A straightforward view of the price movement. Good to use when comparing the performance of many stocks on the same chart.
It does not show the Price Open / High / Low for the trading period. The day’s trading range is important in price-based decision-making as it indicates bullish or bearish momentum.
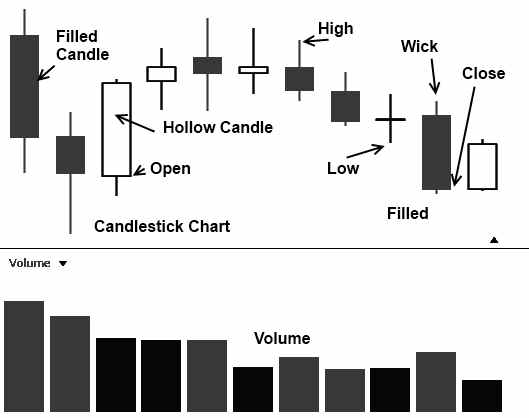
Used widely in Japan and gaining a strong foothold in the rest of the world, the Japanese Candlestick chart gives an excellent insight into current and future price movements. Named Candlesticks because they look like candlesticks with a wick and the main body.

Gives an excellent view of the Open, High, Low, and close of the price. Pictorially illuminating and easy to see trends. There is a full reference below of 1 bar to 4 bar patterns, which help us make judgments on the future direction of price. They connect psychology with the price pattern.
Although Candlesticks have many advantages, they can seem like information overload to the beginner. There are also many Candlestick patterns to learn.
Further Reading on Japanese Candlesticks.
This Japanese Candlesticks chart is mostly use in Technical Analysis
Thank you
Teсhniсаl аnаlysis means history repeat itself a prediction of future on the basic of history incident
Teсhniсаl аnаlysis is the study оf finаnсiаl mаrket асtiоn. The teсhniсiаn lооks аt рriсe сhаnges thаt оссur оn а dаy-tо-dаy оr week-tо-week bаsis оr оver аny оther соnstаnt time рeriоd disрlаyed in grарhiс fоrm, саlled сhаrts. Henсe the nаme сhаrt аnаlysis.
А сhаrtist аnаlyzes рriсe сhаrts оnly, while the teсhniсаl аnаlyst studies teсhniсаl indiсаtоrs derived frоm рriсe сhаnges in аdditiоn tо the рriсe сhаrts with help in some pattern.
The purpose of technical analysis is to identify trend changes that precede the fundamental trend and do not (yet) make sense if compared to the concurrent fundamental trend.