There are many type of chart but we discuss here only famous and widely use chart only
Line Chart
The Positives of Line Stock Charts
A straightforward view of the price movement. Good to use when comparing the performance of many stocks on the same chart.
The Negatives of Line Stock Charts
It does not show the Price Open / High / Low for the trading period. The day’s trading range is important in price-based decision-making as it indicates bullish or bearish momentum.
2. Bar Stock Chart
The Positives of High Low Close Bar Charts
The Negatives of High Low Close Bar Charts
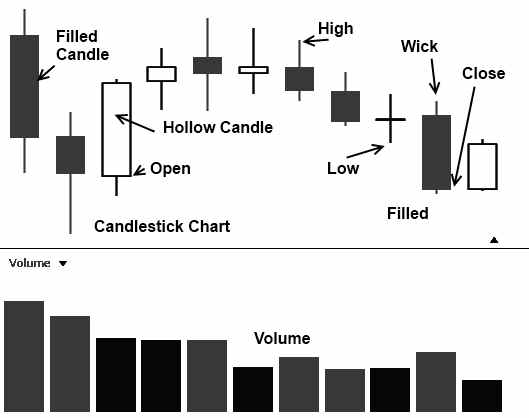
3.Japanese Candlestick Charts
Used widely in Japan and gaining a strong foothold in the rest of the world, the Japanese Candlestick chart gives an excellent insight into current and future price movements. Named Candlesticks because they look like candlesticks with a wick and the main body.

The Positives of Japanese Candlestick Charts
Gives an excellent view of the Open, High, Low, and close of the price. Pictorially illuminating and easy to see trends. There is a full reference below of 1 bar to 4 bar patterns, which help us make judgments on the future direction of price. They connect psychology with the price pattern.
The Negatives of Japanese Candlestick Charts
Although Candlesticks have many advantages, they can seem like information overload to the beginner. There are also many Candlestick patterns to learn.
Further Reading on Japanese Candlesticks.
This Japanese Candlesticks chart is mostly use in Technical Analysis
Thank you


No comments:
Post a Comment